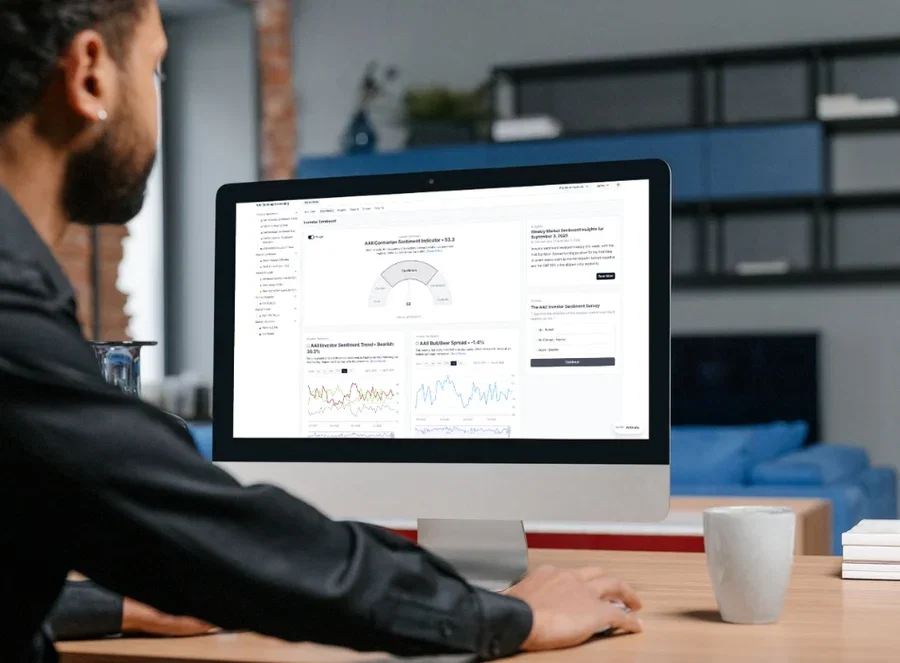
As of September 9, 2026, three of the 13 indicators we measure via our AAII Sentiment Investing Dashboard are flashing red and a fourth just turned orange. Here’s the fast version of what’s happening and why it matters to you:
🔴 AAII Asset Allocation Trend: Investors are more “all-in” on stocks and “out” of cash than they’ve been in 14 straight months (which is a record streak). History says not to chase the rally and think of rebalancing instead. Allocation sentiment remains firmly entrenched in Bearish Contrarian territory as of Monday, August 31, 2026, marking the 14th consecutive month in this state.
🔴 Shiller’s CAPE: Shiller’s CAPE ratio is at 40.49. The market has remained extremely overvalued for 35 consecutive months — which is the second-longest stretch since 1970 — with the CAPE 84% above its historical average. Translation: You might want to temper your long-term return expectations.
🔴 Fed Model: The Fed Model is at –0.95%, which means that bonds now look more attractive than stocks by this measure. This is worth watching, but definitely not worth panicking over.
🟠 Advance/Decline Line (NYSE): The A/D Line is at –835.Market breadth has remained weakly bearish for 15 consecutive days, which means that declining stocks have outnumbered advancing stocks by 835 stocks over the period being measured. Historically, this hasn’t meant much for near-term returns, but it’s a flag to monitor.
And here’s the thing: Those are just the indicators flashing red or teetering on the edge of change. There are 13 indicators in total on the AAII Sentiment Investing Dashboard, each giving you a different window into how the market is really feeling and reacting beneath the surface. For the next few hours only, you can explore all of it for one month for just $2.
This isn’t a “sell everything” signal. It’s a cue to be pickier on valuation, double-check your riskiest holdings and use this data as an overlay to your existing strategy. Since allocation decisions drive the vast majority of portfolio outcomes, understanding when individual investors are making extreme allocation choices provides insight into potential market turning points.
With the CAPE and the Fed Model both in the red and breadth in the orange, the market looks expensive and stretched right now. Favor companies you’ve researched and know are financially solid over hyped-up, richly priced growth names with little room for error.
It’s also worth double-checking any heavy-debt or long-payback holdings, since these tend to get hurt most by higher rates. Make sure your original reasoning still holds up.
One key thing to watch from here: whether the S&P 500 index can hold its momentum and whether the recent improvement in market breadth continues. Rising Treasury yields plus weakening breadth could mean more pressure ahead.
Sentiment data isn’t about predicting the market. It’s about adding context so you can manage risk and stay disciplined during headline-driven moves. That’s exactly what AAII Sentiment Investing helps you do: Track 13 key indicators across sentiment, breadth, valuation and trend, all in one place.
We’ve been tracking investor sentiment since 1987. Our investor sentiment data has appeared in The Wall Street Journal and on NBC and Business Insider ... because it’s trusted, time-tested and tells the real story.
Now, we’ve turned that legacy into a new, powerful sentiment tool built specifically for self-directed investors.
We’re independent. We’re a nonprofit. And for decades, we’ve helped real people turn market signals into smart decisions. This isn’t just another dashboard; it’s a game-changing view into the market’s underlying emotions for investors who want to stay clear-headed when the market goes off-kilter.
Why Market Sentiment Matters More Than Ever
With market volatility and investor anxiety on the rise, understanding sentiment has never been more crucial. Investors like you should care about sentiment for reasons like these:
Markets move on emotion, not just data;
Sentiment peaks before prices crash;
Fear creates opportunity, if you see it early;
The crowd is often wrong at extremes; and
Ignoring sentiment = flying blind.
AAII Sentiment Investing is a powerful addition to the tools and services you already use. It offers a kind of X-ray vision into investor emotion because it’s there not to predict the market, but to help you understand what’s driving it beneath the surface.
When paired with price structure, macroeconomic positioning, valuation frameworks, fundamental analysis or your own strategy, it brings sharper focus and deeper insight to every decision.
And now you can explore everything for an entire month with our low-risk trial.
Weekly insights and commentary on sentiment trends
Action-oriented takeaways based on sentiment extremes
Bonus educational content (webinars, articles and guides)
Access to an archive of sentiment trends and research
Dedicated community forum for discussion
The weekly Market Health Check report
30 days of risk-free access
AAII Membership benefits like the AAII Journal, AAII Shadow Stock Portfolio, investor guides, weekly emails, 50+ stock screens, webinars, local chapters and more
The Indicators AAII Sentiment Investing Tracks
When you get access to the Sentiment Dashboard, you will be able to explore 13 key indicators such as:
AAII Investor Sentiment Trend
AAII Bull/Bear Spread
AAII Contrarian Sentiment Indicator (CSI)
AAII Asset Allocation Trend
Short Interest Diffusion
Yield Curve
Advance/Decline (A/D) Line
Arms Index (TRIN)
New Highs/New Lows (NYSE)
CBOE Volatility Index (VIX)
S&P 500 Trend
Shiller’s CAPE Ratio
Fed Model
Sentiment data should not be overlooked. When used correctly, these indicators provide important context for making more informed decisions. Without them in one place, there is a greater risk of relying on incomplete or fragmented views of market conditions.
For the next few hours, you can get a full month of AAII Sentiment Investing (report, dashboard and insights all included) for just $2.
Once tonight’s flash sale ends at midnight Central Time, AAII Sentiment Investing returns to its full annual price.
This is the best time to have sentiment data at your fingertips. Why? Because we’re heading into the fall market, historically one of the busiest stretches for fast investing and economy moves. That’s exactly when having a clear understanding of how to apply and interpret sentiment data pays off most.
We know many of our fellow investors focus on long-term moves and may be skeptical of sentiment as a factor, but that's exactly the point. Sentiment data isn’t here to replace that approach; it’s here to sharpen it.
Think of it as a second lens: the behavioral and psychological context that sits alongside your existing research, helping you fine-tune decisions on risk, allocation and timing.
Get a full year of pro-level resources built to help you stay ahead of shifting market conditions, instead of reacting to them after the fact when the market has drastically changed, leaving you in the dust.
Not sure yet if sentiment data is right for you? You don’t have to decide today. Your purchase comes with a 30-day money-back guarantee, so you can explore the dashboard, see which indicators are flashing red or orange, dive into the indicators that have recently turned green, read the insights, and check out the weekly report.
After all, the best way to understand what this dashboard can do for your strategy isn’t reading about it, it’s seeing it for yourself.
P.S. This is an email-only offer and is not available anywhere on our website. Please do not forward this special trial offer, as this invitation is intended just for you.
We make no representations or warranties that any investor will, or is likely to, achieve profits similar to those shown, because past, hypothetical or simulated performance is not necessarily indicative of future results. Before making an investment decision, you should consider your circumstances and whether the information on our content is applicable to your situation. This information was prepared in good faith and we accept no liability for any errors or omissions. The full disclaimer can be read here.