
We just gave our charts a major upgrade.

Is this your brand on Milled? Claim it.
|
Now introducing: Atom Advanced Charts on desktop.  Introducing Advanced Charts Does recent market activity have you wondering whether to enter or exit? We’ve got you covered. Dig into the pricing action with our new charting features on the Atom desktop platform. 
Available only on desktop Here's what else you can do with Advanced Charts: 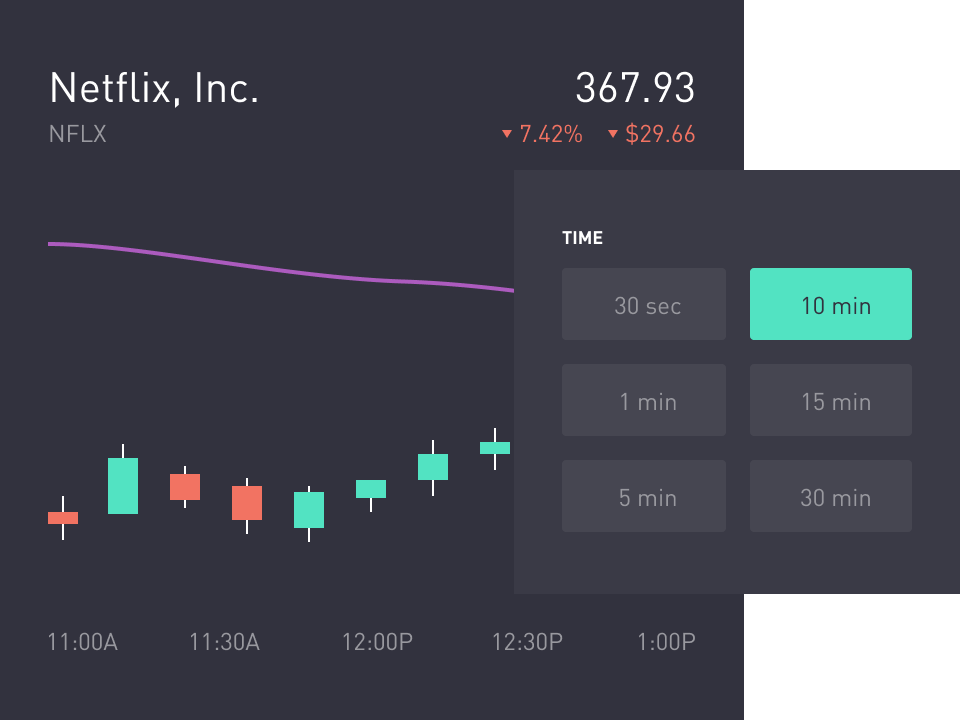
Power your next investment idea. Whether you’re anticipating price movements, examining volume, or determining a specific entry point for a position, vibrant chart views with custom time intervals (including seconds) are at your fingertips to give you command of the markets. 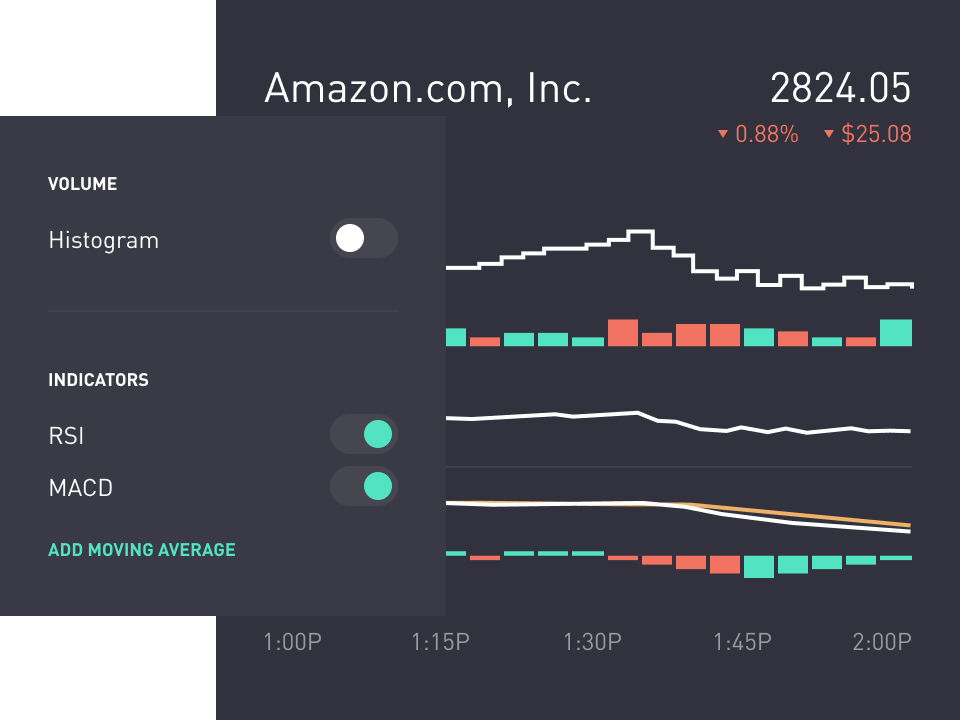
Get technical. Uptrend or downtrend. Overbought or oversold. Pick from a library of popular technical indicators (like RSI and MACD) to identify greater trading opportunities in price trends and patterns. You can also overlay your stock chart with company events such as earnings releases and presentations to maximize your chart’s impact. 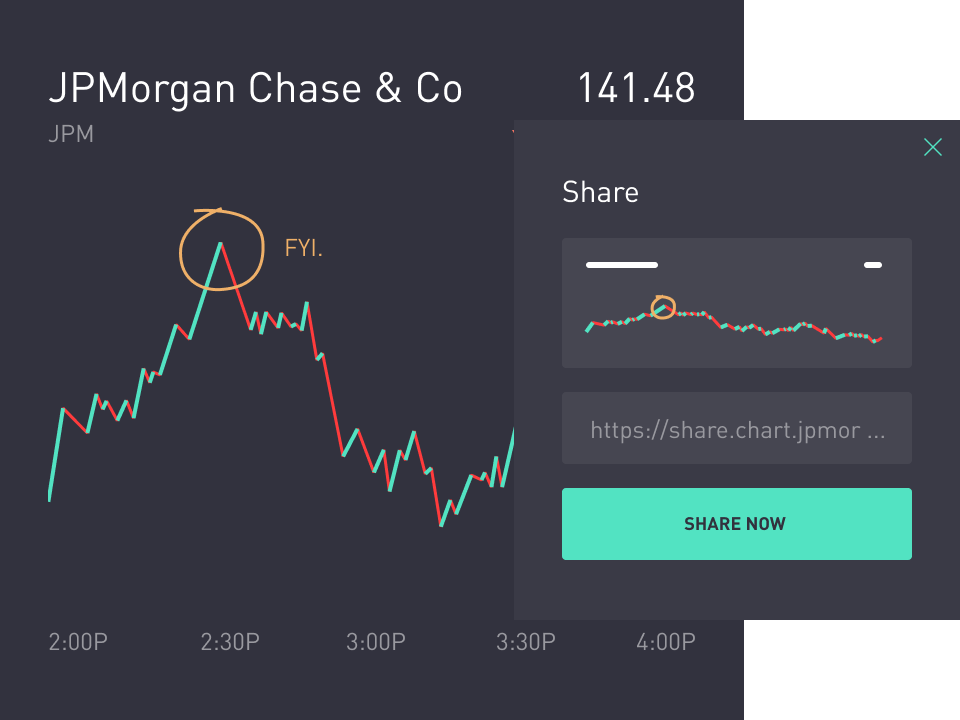
Draw. Analyze. Share. Draw trend lines with rich interactive drawing tools, highlight buy and sell signals, add captions, record your observations and inspire others with your creativity by publishing your own analysis with share options.
©2021 ATOM FINANCE, INC TERMS OF USE PRIVACY POLICY UNSUBSCRIBE |